Leveraged ETFs:It’s no longer just a problem for the people who buy them
20 August 2026 _ News

Leveraged ETFs have gone from a niche product to a market-moving force: 7 billion in exposure, 58% of it concentrated in a handful of stocks linked to artificial intelligence. How does daily rebalancing work? Why does it force a fund to buy when the stock rises and sell when it falls? And what is the cost for investors who stay in for more than one day?
During the hottest days of July in Seoul, the combined trading activity in just two stocks — Samsung Electronics and SK Hynix — and the leveraged ETFs built around them accounted for 70% of all daily trading activity in the Korean stock market. The Kospi, the benchmark index of one of the world’s ten largest stock exchanges, became more volatile than Bitcoin. And a single Hong Kong-listed fund tracking a single stock, the 2x leveraged CSOP SK Hynix ETF, surpassed billion in assets at its peak: so large relative to the daily trading volume in SK Hynix shares that some investors began arguing that the fund had stopped merely tracking the stock and had started moving it.
Two Sundays ago, when we covered the Korean market crash, leveraged ETFs remained in the background: they appeared in a Goldman Sachs estimate suggesting that, on some days, their forced rebalancing accounted for the majority of market selling. In the following issue, we looked more closely at the unintended effects of leverage in the Aschenbrenner case: a hedge fund leveraged four times its equity capital, unwound in just three weeks. We ended by noting that the same dynamics also exist, at a smaller scale, in instruments that anyone can buy from home with a few clicks. This newsletter is about those instruments.
Not to demonize them: leveraged ETFs do exactly what they say they will do. The problem is that almost nobody reads what they actually promise, and their growth has now crossed the threshold beyond which the risk no longer remains confined to the people who bought them.
Small in assets, enormous in trading volume
At first glance, the sector looks irrelevant. Leveraged ETFs manage about 0 billion globally, compared with more than trillion across all ETFs: roughly 1.1% of the total. If systemic risk were measured by assets under management, the discussion would end here.
But assets are the wrong measure, because these products are not held: they are traded. Daily trading value in leveraged ETFs has tripled from the January low to the June peak, reaching roughly billion on a 30-day average — from about billion to billion in six months. Today, after the pullback that followed the Korean episode, average daily trading volume is around billion for bullish products and billion for inverse ones: billion a day traded by a sector representing just 1% of ETF assets.
From this, you can derive a figure that says almost everything about how these instruments are actually used. Divide assets under management by daily trading volume and you get the “implied holding period,” expressed in days: roughly one day for inverse products ( billion in assets ÷ billion in daily trading volume = about 1.1 days), and around five days for bullish products (more than 0 billion in assets ÷ billion in daily trading volume = about 5 days).
The holding period recommended by issuers, for both categories, is one day. Over the past four years, the gap has narrowed for bearish products and widened for bullish ones: when markets are rising, investors tend to forget the instruction manual.
Where did all the leverage go? From 3 billion to 7 billion
A recent Bloomberg analysis of roughly 800 bullish leveraged equity ETFs estimates their notional exposure by multiplying each fund’s assets by its stated leverage multiple and then — for index-based funds — allocating that exposure across the underlying stocks according to their index weights.
The result has quadrupled in four years. But the most interesting part is not the growth itself: it is the composition.
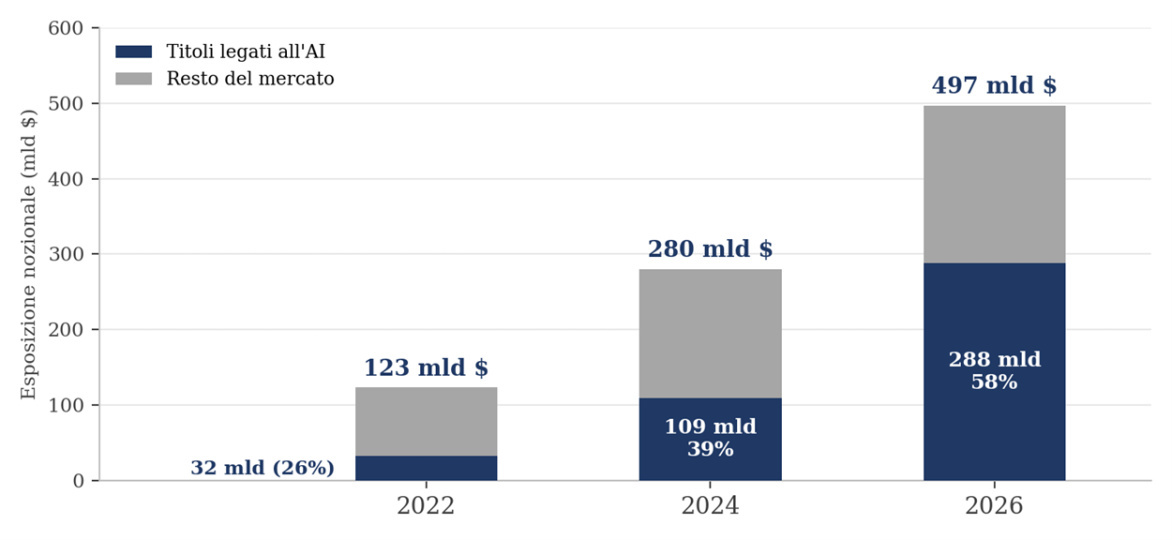
Notional exposure of bullish leveraged equity ETFs and the share attributable to AI-related companies. Notional exposure is estimated as assets under management × stated leverage multiple; 2022 and 2024 figures are year-end snapshots, while 2026 represents the 30-trading-day average between June 26 and August 6. Source: Bloomberg; our calculations based on dollar values.
The AI-related share has risen from 26% in 2022 to 58% today. In dollar terms, leveraged exposure to AI stocks has climbed from roughly billion to about 8 billion: a ninefold increase in four years, compared with a fourfold increase in the overall market. And within those 8 billion, concentration is extreme: ten companies account for two-thirds of the total, or roughly 0 billion, led by Nvidia, SK Hynix and Micron. Among single-stock leveraged ETFs alone, four memory-chip makers account for almost half of the category.
One clarification is important to avoid misreading the chart: that exposure comes through two different channels. The first is leveraged index ETFs, in which AI stocks have simply gained weight over time — for example, no one explicitly decided to buy more Nvidia. The second is single-stock leveraged ETFs, where that choice is explicit. The first channel is passive and almost invisible concentration; the second is active and declared concentration. Both end up adding exposure in the same place.
Fund flows confirm where the newly raised capital has gone. Since mid-2025, single-stock leveraged ETFs tied to the major memory-chip producers have attracted more than billion in net inflows, with billion concentrated in just three names: .8 billion in SK Hynix, .3 billion in Samsung and .9 billion in Micron. Sixteen of these products on Samsung and SK Hynix were listed in Korea on May 27, 2026; in less than a year since launch, vehicles tied to those two stocks have become some of the largest single-stock leveraged ETFs in the world.
A few numbers to understand how it works
This is the core of the issue. A 2x leveraged ETF promises twice the daily return of its underlying asset. To keep that promise, it has to reset its exposure to twice its net asset value at the close of every trading session. But net asset value and exposure move at different speeds: if the stock rises by 10%, the fund’s exposure rises by 10% while its capital rises by 20%. The fund therefore becomes underexposed and has to buy. If the stock falls, it has to sell. This is not a portfolio manager’s decision: it is a contractual, mechanical requirement, with no discretion involved.
The formula is straightforward. With leverage L and an underlying return r, the fund must trade an amount equal to L × (L − 1) × assets × r. The multiplier L(L−1) is the only number that matters:
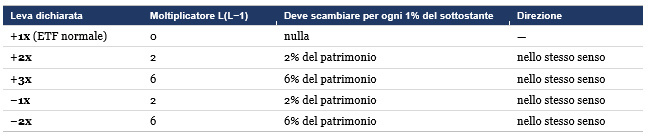
Two consequences follow, the second one deeply counterintuitive. First: moving from 2x to 3x leverage does not increase the rebalancing requirement by one and a half times, but by three times. Second: the last column says “in the same direction” even for inverse funds. After a rise, a bearish fund has lost capital while its short position has grown in relative terms: to return to its target multiple, it has to buy back exposure. In other words, it buys when the stock rises, exactly like a bullish fund. Bullish and bearish funds on the same stock rebalance in the same direction. The widespread idea that the two offset each other is wrong.
A concrete example, using public figures. The 2x leveraged CSOP fund on SK Hynix was worth almost billion at its peak. For every 1% move in the stock, that fund alone had to trade roughly 0 million of exposure at the close. On one of the −15% sessions SK Hynix recorded in July, that figure rises to roughly .1 billion of selling, concentrated in the final minutes of the trading day.
At the system level, Nomura estimated that at the June peak in assets, for every 1% move in the underlying securities, the leveraged ETF complex had to buy or sell roughly billion of stocks.
The delicate point is when all of this happens. Rebalancing is tied to the closing price, so it becomes compressed into the final minutes of the session, alongside index rebalancing, options hedging and institutional orders. This is the risk Rocky Fishman of Asym Research identifies as the most concerning: a sudden event close to the market close that forces funds to do in a few minutes what would ideally take many hours.
The Korean case: a real-world stress test
South Korea became the unintended laboratory for all of this. At the beginning of 2026, the regulator authorized more than a dozen leveraged ETFs on Samsung and SK Hynix, two companies that already dominated the Seoul stock market. The motivation was not ideological but defensive: Korean savers were sending billions into similar products listed in Hong Kong, and the alternative was to lose that flow. The sixteen domestic funds listed on May 27 attracted more than billion in two months.
Then the market turned. At the point of maximum stress, as noted earlier, leveraged funds and the two underlying stocks accounted for 70% of all trading on the Seoul market. The regulator responded with a rapid sequence of measures: a temporary suspension of new listings; the minimum investor deposit tripled from 10 million to 30 million won, cash only, with no substitute collateral, brought forward to July 31; the minimum trading lot raised from 1 to 20 shares; and, on July 30, a 20% cap on the share these products could represent in an individual investor’s overall portfolio. The authorities themselves projected that the segment would shrink from roughly 12 trillion won to 4–5 trillion won.
An important clarification: leveraged funds did not cause the sell-off. The drivers were memory-chip prices, weaker-than-expected earnings, financing costs and, in the background, hedge funds being forced to unwind positions. But by adding a huge amount of leveraged exposure to two stocks that already carried most of the index’s weight, those funds are regarded as a key contributor to the magnitude of the swings. The distinction between cause and amplifier is not an absolution: it is the precise description of the role they played.
This is not the first time, nor is it a phenomenon confined to emerging markets. In February 2018, leveraged products linked to the VIX index had become so large that their rebalancing contributed to the biggest spike ever recorded in the index, wiping out billions of dollars in positions. In 2024, newly listed leveraged ETFs on Strategy Inc. were cited as amplifiers of a stock that was already extremely volatile.
Why the risk may be different from what it seems
To understand the issue without slipping into alarmism, it is worth making a few more technical distinctions. Our objective, of course, is not to demonize leveraged ETFs — transparent, regulated and entirely legitimate financial vehicles — but to understand the actual dynamics behind some of these numbers.
The first mechanism hidden behind the headline trading-volume figures is very concrete: not every dollar traded in an ETF translates directly into a trade in the underlying stocks. If one investor buys a share during the day and another sells one, the market can match those orders internally. Money changes hands on the screen, but no corresponding transaction in the actual underlying securities ever takes place.
There is also a second point concerning the true scale of the phenomenon: proportionally, the overall amount of leverage in the market has not exploded compared with the past. The real novelty is not how much leverage exists, but where it is being directed. In the past, leverage was spread across broad equity indices — financial oceans capable of absorbing enormous flows of liquidity without flinching. Today, by contrast, an increasing share of that activity is concentrated in individual stocks, where daily trading volumes are inevitably smaller.
The bill for investors: volatility decay
There is one risk, however, on which everyone agrees: the risk borne by the investor holding these products. The 2x promise applies for a single trading day. Beyond fees, over longer horizons two additional factors come into play: the cost of resetting positions every evening and a mathematical phenomenon known as volatility decay, under which value erodes when the underlying asset fluctuates, regardless of where it ultimately ends up.
The most instructive example is one in which the stock does not move at all over the full period. Take twenty alternating trading sessions: +10%, then −9.09%, then +10% again, and so on. At the end of day twenty, the stock is exactly back where it started. The two 2x leveraged ETFs built on it, however, are not.
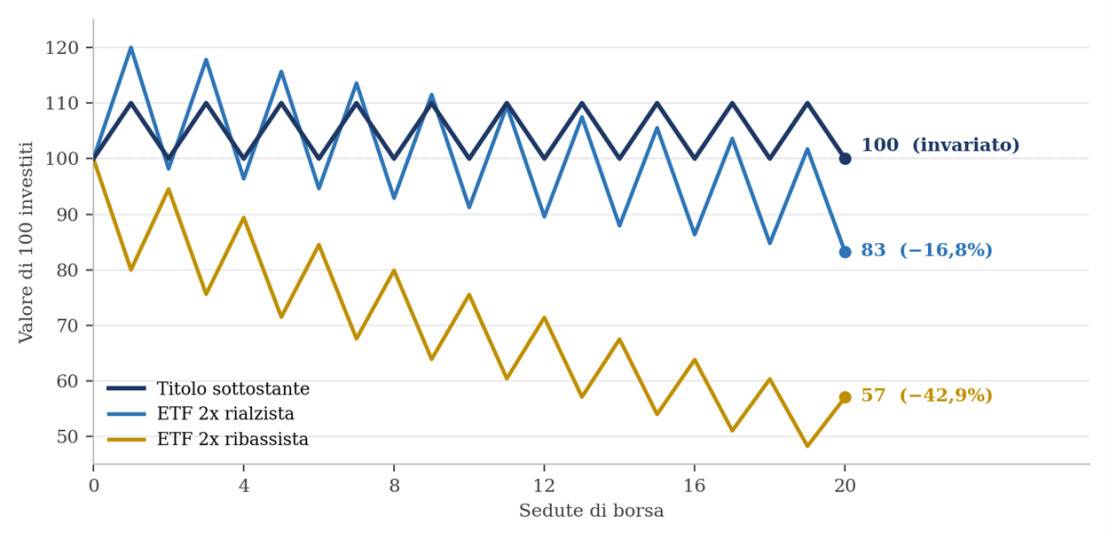
Simulation over twenty alternating trading sessions (+10% and −9.09%), bringing the stock exactly back to its initial value. The funds replicate twice the daily percentage move each day, before fees and financing costs. Our calculations.
In a steady decline, compounded leverage loses less than the label might imply, because each successive drop is applied to an ever-smaller base: volatility decay punishes oscillation, not trends. The problem shifts to the recovery, which is not symmetrical:

This is not a theoretical issue. Some of the largest leveraged ETFs on SK Hynix have lost nearly 50% since their late-May listing in Seoul, and by early July almost all Korean products tied to Samsung and SK Hynix were trading below their offering price. That is also one reason why U.S. rules have effectively capped leverage at 2x for new products: the few existing 3x funds survive for historical reasons, while attempts to list additional ones have been rejected.
There is one final layer of risk that no prospectus can neutralize: when an instrument is held predominantly by retail investors, a positive day fuels fear of missing out, while a negative one fuels panic. The mathematics of decay is predictable; the behavior of the people experiencing it is not.
What deserves a little more thought...
— The 2x is only true for one day, and the prospectus says so. Everything else — the month, the year, the actual return — is outside the promise. A product held for five days when it is designed for one is not necessarily a bad investment: it is a misuse of the instrument.
— Anyone buying a leveraged ETF is also taking on a forced seller. The manager does not decide: the fund sells when the stock falls and buys when it rises, every evening, without exception. In a normal portfolio, discipline is a virtue; here it is an automatic mechanism that systematically acts at the worst possible moment.
— Bullish and bearish products do not offset each other. On the same stock, both rebalance in the same direction, and an investor holding both can lose on both sides. There is no true hedge between two instruments that share the same mathematical flaw.
— The liquidity of the underlying asset is the real constraint, not the size of the fund. A billion product on a global index may be irrelevant; the same product on a single stock can become one of its dominant traders. Before buying a single-stock leveraged ETF, the useful question is: how large is this fund relative to the stock’s daily trading volume?
— The ratio of trading volume to assets is a measure of crowding. An instrument that trades a large fraction of its assets every day is probably not one in which people are investing: they are all making the same short-term bet, in the same direction, over the same horizon.
— The fact that it is an ETF does not make it an investment. The legal structure tells you how the vehicle is built, not whether it is suitable for the person buying it. Korean authorities raised the barriers to access precisely because ease of purchase and suitability are two different things.
One final note for anyone looking at a losing position and considering averaging down. Volatility decay is not something patience repairs: it operates every day the underlying asset fluctuates, and it becomes more severe precisely when volatility rises — exactly when the temptation to wait is strongest.
With a leveraged ETF, time is not the ally of the investor who is right. It is a fixed cost.
The contents of this informative message are the result of the free interpretation, evaluation and appreciation of Pharus Asset Management SA and constitute simple food for thought.
Any information and data indicated have a purely informative purpose and do not in any way represent an investment advisory service: the resulting operational decisions are to be considered taken by the user in full autonomy and at his own exclusive risk.
Pharus Asset Management SA dedicates the utmost attention and precision to the information contained in this message; nevertheless, no liability shall be accepted for errors, omissions, inaccuracies or manipulations by third parties on what is materially processed capable of affecting the correctness of the information provided and the reliability of the same, as well as for any result obtained using the said information.
It is not permitted to copy, alter, distribute, publish or use these contents on other sites for commercial use without the specific authorization of Pharus Asset Management SA.