Record profits, stocks in the red: the market is gripped by uncertainty over AI and the Fed
30 July 2026 _ News

I’d like to start with an image, because it describes the state of the market better than any number. It’s an image by Spencer Jakab, a financial journalist for The Wall Street Journal and one of Wall Street’s most followed analysts, which I found perfect: right now, the stock market resembles a duck. On the surface, it glides across calm water, changing direction every now and then, serene. Beneath the surface, however, its feet are paddling furiously to keep up with the ever-changing currents. There you have it: the U.S. market these days is exactly that duck. On the surface, the S&P 500 is just a hair’s breadth away from its record highs, and the VIX—the so-called “fear index”—remains around 20, below its long-term average.
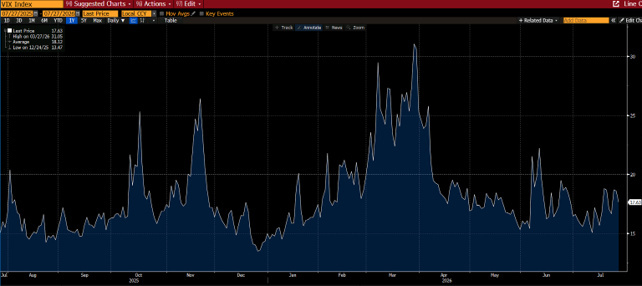
Everything seems calm. But beneath the surface, within the index, investors are scrambling frantically. And understanding what’s happening beneath that apparent calm is the key to interpreting the entire week.
Since the start of the year, there have been 52 trading sessions in which the S&P 500 closed in one direction while most of the stocks that make up the index moved in the opposite direction. Fifty-two. That number already matches the tumultuous year of 2000—the year of the dot-com bubble—and it’s only July.
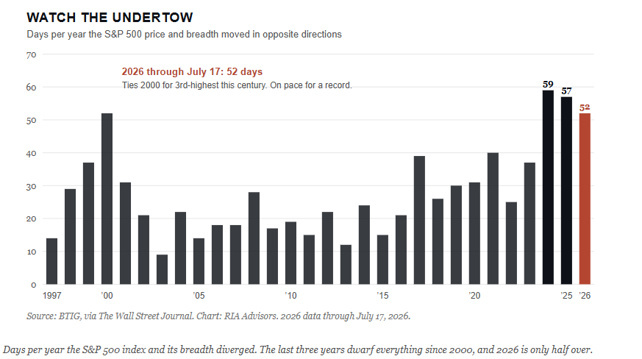
In practice, the index’s calm masks widespread unease beneath the surface. There is also a second indicator that confirms this: while the VIX is low, its cousin, the VIXEQ—which measures expected volatility in individual stocks—is above 50, a level reached only during market events such as Liberation Day or the COVID-19 pandemic.
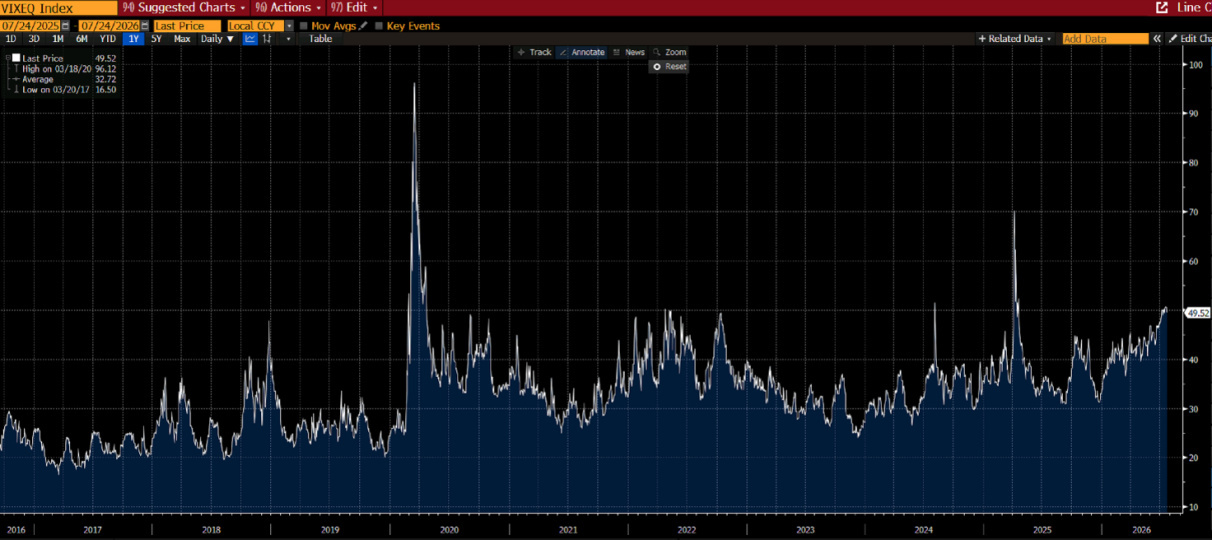
In other words: Investors aren’t buying protection against a broad market crash, but rather protection on specific stocks—almost all of which are tied to the theme of artificial intelligence. It’s not fear of a market crash. It’s fear that some of the rally’s stars might fall.
The driving force behind all of this this week was the quarterly earnings reports from the tech giants, and something happened here that says a lot about the current climate. On Wednesday, Alphabet, Google’s parent company, and Tesla reported their results. Look at the numbers: Alphabet beat expectations on both revenue and earnings, with its cloud business growing 82% year-over-year. Objectively speaking, these are extraordinary numbers. Yet the stock plummeted by more than 7%. Tesla, for its part, lost nearly 14%. Why these reactions? Not because of revenue, which grew. But because of spending. Alphabet raised its capital expenditure forecast to a range of 5 billion to 5 billion, and for the first time in its history, its cash flow turned negative.
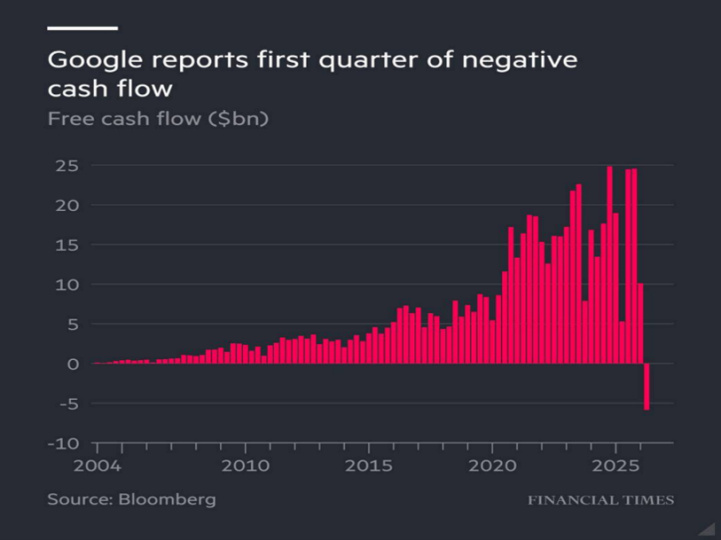
Investors weren't spooked by a failure or a decline in business performance; rather, they began to wonder whether this massive spending on artificial intelligence will actually generate returns that justify such high prices.
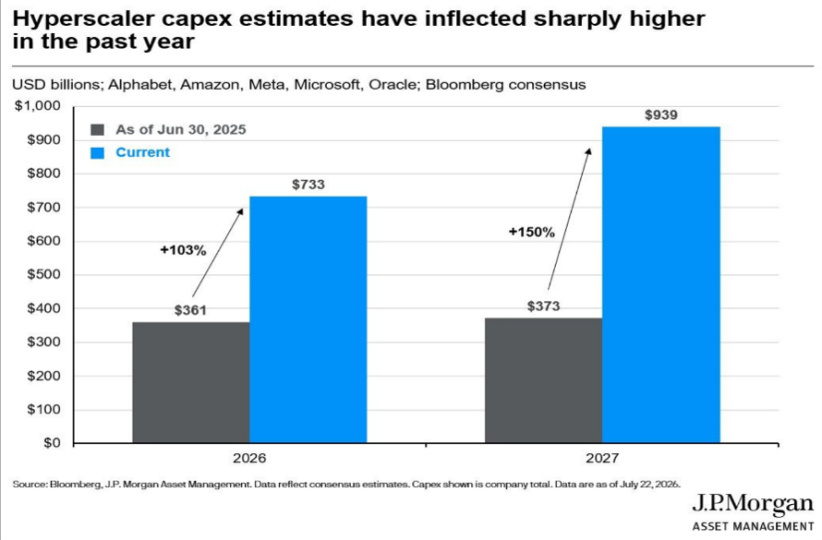
It’s the same scenario we’ve been discussing over the past few weeks with TSMC and ASML, but here there’s a new element worth highlighting, because it’s the real heart of the market debate. Capex—that is, capital expenditures—has become a double-edged sword in investors’ perceptions. On the one hand, it fuels the rally: one company’s spending is another’s revenue, and the more than 0 billion that tech giants will invest this year in data centers translates into revenue for manufacturers of chips, turbines, cooling systems, and energy. It’s no coincidence that while Alphabet’s stock plummeted, shares in AI-related power infrastructure rose. On the other hand, however, when that spending erodes cash flow, the market begins to wonder: what if the return never materializes? It is the fear—which resurfaced this week with the launch of a powerful Chinese open-source model, a new “DeepSeek”—that someone might achieve the same results while spending far less, rendering these colossal investments futile. There’s no answer to that question today. But it’s the question of all questions that drives prices.
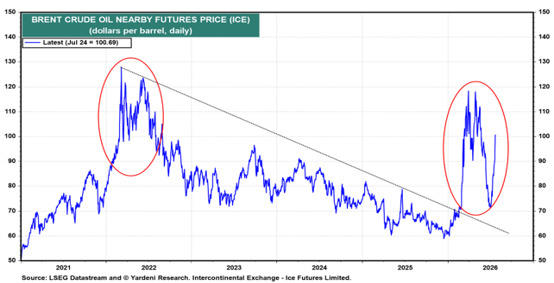
And here comes the second leg of the week, the one that complicates everything: geopolitics is back, and with it, oil. The ceasefire between the United States and Iran has definitively collapsed. Fighting has resumed, the Houthis have attacked Saudi oil tankers in the Red Sea, Trump has threatened an unprecedented military escalation, and Brent crude has surged again, reaching over 0 per barrel in some trading sessions before pulling back slightly on hopes of a diplomatic truce.
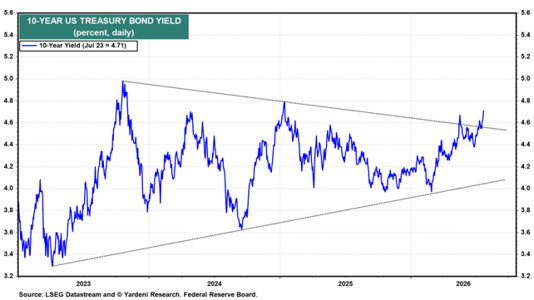
This has a direct effect that we need to explain clearly, because it ties all the pieces together: rising oil prices push up expected inflation, expected inflation pushes up bond yields, and the yield on the 10-year Treasury note has climbed back toward 4.70%—and in some trading sessions even higher—approaching its highest levels since early 2025.
There's one piece of data I found particularly insightful in this week's material: since February, the correlation between the price of oil and the yield on the 10-year U.S. Treasury note has ranged between 0.70 and 0.75.
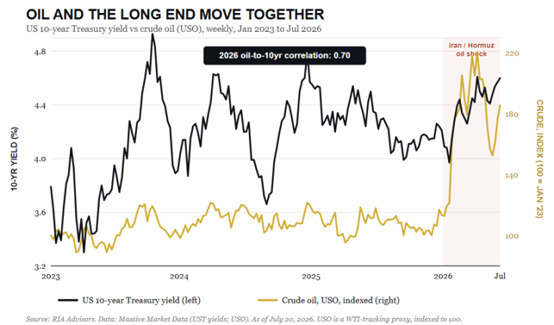
This is no coincidence. It means that the recent rise in interest rates does not reflect a stronger economy or new concerns about public finances: above all, it reflects a premium for oil-driven inflation. Simply put, the bond market is currently pricing in the cost of a barrel of oil, not the health of the economy.
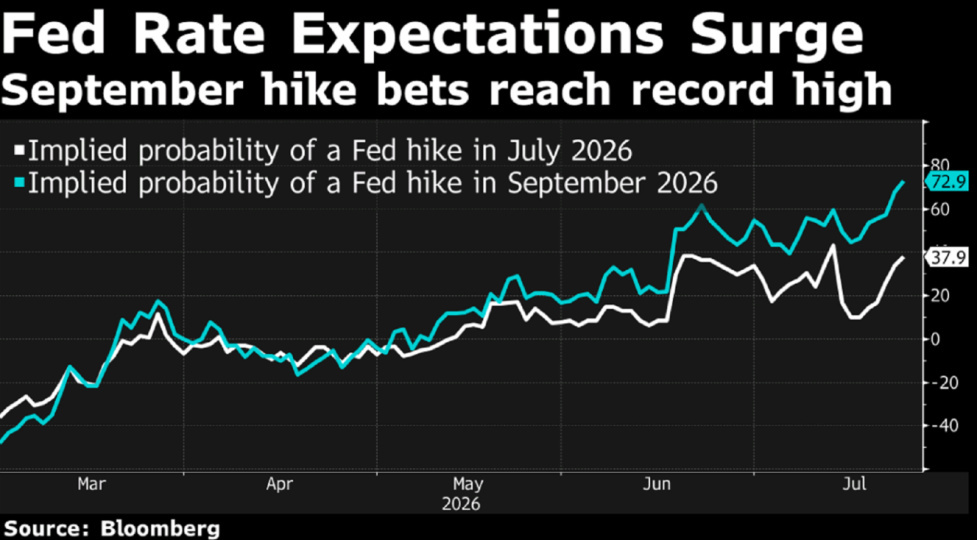
This interplay puts the Federal Reserve in an extremely uncomfortable position right on the eve of its July 28–29 meeting. The June inflation data had been encouraging, but that relief—which arrived with the usual statistical lag—reflects oil prices that were much lower than they are today. The interest rate futures market has come to price in a probability of around 35% for a rate hike as early as this meeting, with a September hike seen as even more likely. This was not a scenario considered just a few weeks ago. The consensus remains for rates to stay steady, but the mere fact that talk of a rate hike has resurfaced—after a year of discussions about cuts—shows just how much the landscape has changed.
Having said all that—and here I must strike that balance that is at the heart of our profession—it would be a serious mistake to view this week solely in a negative light. Because beneath the surface, there isn’t just weakness: there’s also an orderly and, in its own way, healthy rotation. While technology and momentum stocks are correcting—the semiconductor index has fallen more than 20% from its June highs—capital isn’t fleeing the market. It’s shifting. Banks have reported record profits. The healthcare sector has finally emerged from years of stagnation, with biotech at record highs driven by a wave of mergers and acquisitions. Industrial stocks—and railroads in particular—are posting very solid results, a sign that the real economy—the economy of transportation and goods—continues to function. And energy, which we had reason to view as a natural hedge against geopolitical escalation, is doing exactly what it’s supposed to do. It’s no coincidence that the Equal Weight index—where all companies are weighted equally—is holding up much better than the traditional index dominated by tech giants. The market is broadening, not narrowing. And a broadening market is structurally more robust than one driven by just seven stocks.
So what do we take away from this in practical terms? First: don’t be fooled by the calm in the index. The negative spread tells us that the risk this time isn’t so much a sudden crash as a violent rotation across sectors, and a portfolio overly concentrated on AI winners is exposed precisely to this. Second: respect the ongoing rotation toward financials, healthcare, high-quality industrials, and energy—which isn’t a fad but a reflection of where earnings and cash flows are actually heading. Third, on the bond front, a point that this week’s material highlights well: if oil follows the most likely scenario—a decline over the next eighteen months, as suggested by forward curves—then the inflation premium on yields will narrow, and buying duration today, with the U.S. 10-year yield above 4.70% and the Italian 10-year yield above 4%, could prove very attractive.
The contents of this informative message are the result of the free interpretation, evaluation and appreciation of Pharus Asset Management SA and constitute simple food for thought.
Any information and data indicated have a purely informative purpose and do not in any way represent an investment advisory service: the resulting operational decisions are to be considered taken by the user in full autonomy and at his own exclusive risk.
Pharus Asset Management SA dedicates the utmost attention and precision to the information contained in this message; nevertheless, no liability shall be accepted for errors, omissions, inaccuracies or manipulations by third parties on what is materially processed capable of affecting the correctness of the information provided and the reliability of the same, as well as for any result obtained using the said information.
It is not permitted to copy, alter, distribute, publish or use these contents on other sites for commercial use without the specific authorization of Pharus Asset Management SA.