Oil and stagflation: dispelling myths with numbers
04 March 2022 _ News

Despite the angst caused by the 65% increase in oil prices this year, concerns about a return to 1970s-style stagflation are exaggerated and the developed world, at least, can probably handle even more expensive crude without too much stress. There are in fact three main reasons why Oil even $ 150 will not lead to stagflation.
1. Oil intensity in the economy
Energy intensity is significantly lower than in the 1970s. The volume of oil consumed per unit of gross domestic product fell by 56% between 1973 and 2019, according to the Center for Global Energy Policy at Columbia University.
- Whereas in 1973 it took just under a barrel of oil to produce $ 1,000 of economic output, the amount has fallen to less than half a barrel. The amount of oil needed to produce $ 1,000 of global GDP (0.43 barrels in 2019) has thus decreased by about 0.01 barrels every year for the past three and a half decades.
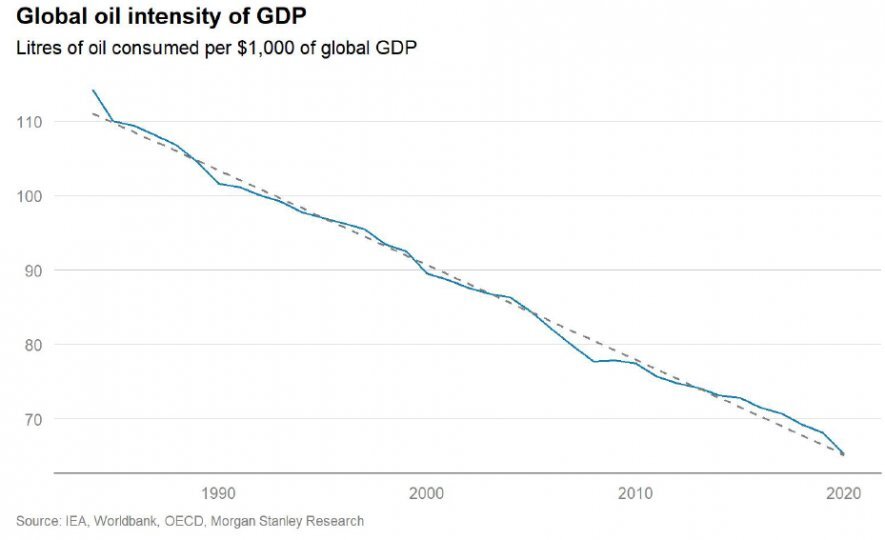
- Since 1984, oil intensity has declined every year in an almost perfectly linear trend: the amount of oil used per dollar of world GDP has declined by roughly the same amount every year. Wars and revolutions, booms and crashes, OPEC successes and failures, and every other monumental event of the last 35 years have left their imprint on oil markets, but they have NOT altered the downward constant of oil intensity. This kindof regularity is very rare in any long-standing trend, in economics or in energy.
- These steady volumetric improvements in the oil intensity metric are probably the result of a shift in the composition of oil demand from intermediate to final consumption. The typically single-fuel appliances associated with final consumption (such as a new car or boiler) limit inter-fuel substitutability and price elasticity, while for intermediate consumption (such as in a power plant or petrochemical plant) there may be a greater allowance for fuel switching . Globalization has helped to spread end-user equipment efficiency gains rapidly and evenly around the world.
- This trend also reflects a gradual regime change from a supply-constrained to a demand-constrained global oil market. In percentage terms, oil intensity first decreases at rates lower than GDP growth, allowing global oil demand to increase. Over time, given its linear functional form, the rate of decline in intensity will accelerate to exceed the growth rate of global GDP, in which case global oil demand will peak and begin to decline.
In conclusion, to give a concrete example of the limited impact on the real economy, it is enough to consider that end-users such as motorists still rely on gasoline, but thanks to technological advances, the average American car gets about 25 miles per gallon compared to 13 miles in 1975.
2. Economic sectors in the 1970s compared with today
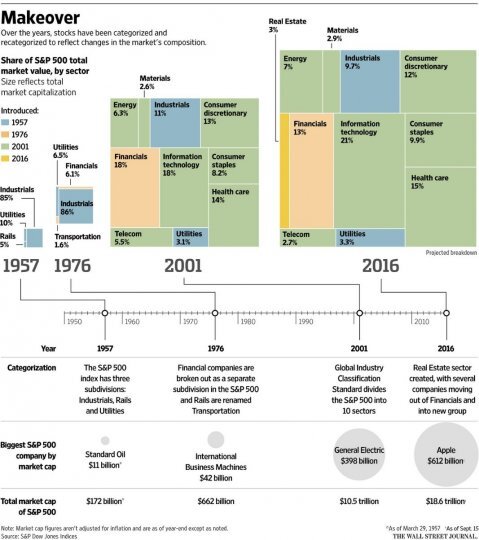
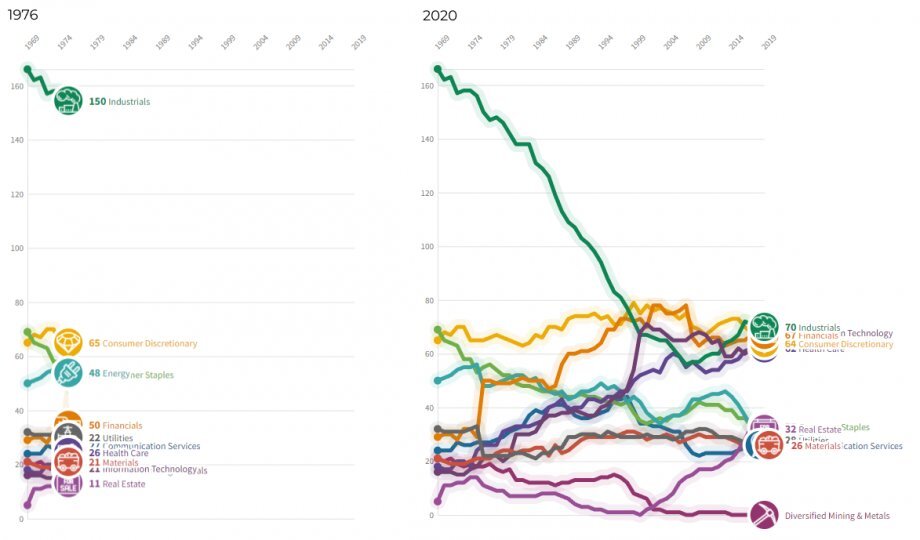
An example of the declining importance of oil in the economy can be analyzing the weight of commodity-related sectors in the S&P500, which has changed dramatically over the last 50 years. The industrial sector has gone from 86% in 1976 to 8% today.
3. Oil price compared to Equity Assets
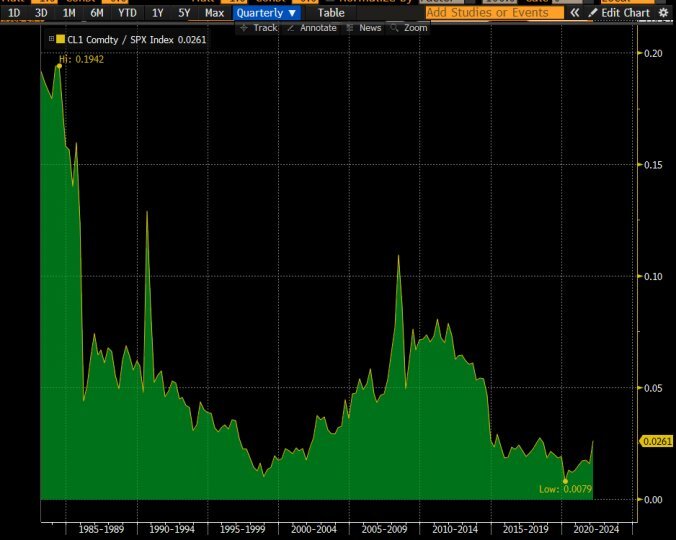
Furthermore, if we want to compare the oil levels of the 1970s to the present, we also have to consider that in the last 50 years inflation but especially the stock markets have grown more than the oil value:
Risks
However, risks need to be considered. According to some analysts, oil prices historically become problematic when energy costs exceed 8.8% of global GDP, levels last seen in 2008. As of the 8 October, the energy share was was 5.6%, so we are still far from the threshold.
More attention should be paid to emerging markets, which may be more affected by higher oil prices in the short term.
More attention should be paid to emerging markets, which may be more affected by higher oil prices in the short term.
Conclusion
In conclusion, the reduction in the intensity of oil use in the economy, driven by the digital transformation that has changed the global economic structure, reducing the weight of traditional sectors in favor of tech, has made economies less dependent on commodity trends of the matter. For this reason, looking at oil values in the 1970s and comparing them with today makes little sense. Economies are able to sustain much higher oil values than in the past before this can create problems for the economic slowdown. In the short term, the negative effects may affect sectors and countries that are more dependent on the raw materials, such as the emerging economies, but they will not affect the US economy, for example, where technology and communication are predominant.
Information message - The information in this message is produced for information purposes only and therefore does not qualify as offer or recommendation or solicitation to buy or sell securities or financial instruments in general, financial products or services or investment, nor an exhortation to carry out transactions related to a specific financial instrument.
The contents of this informative message are the result of the free interpretation, evaluation and appreciation of Pharus Asset Management SA and constitute simple food for thought.
Any information and data indicated have a purely informative purpose and do not in any way represent an investment advisory service: the resulting operational decisions are to be considered taken by the user in full autonomy and at his own exclusive risk.
Pharus Asset Management SA dedicates the utmost attention and precision to the information contained in this message; nevertheless, no liability shall be accepted for errors, omissions, inaccuracies or manipulations by third parties on what is materially processed capable of affecting the correctness of the information provided and the reliability of the same, as well as for any result obtained using the said information.
It is not permitted to copy, alter, distribute, publish or use these contents on other sites for commercial use without the specific authorization of Pharus Asset Management SA.
RELATED CONTENTS