Stagflation? No, Boom-Inflation
31 March 2022 _ News

In recent months we often hear talk about Stagflation, but let's not lose our bearings and look at the numbers for the US economy. Before going into the numbers, let's summarize and contextualize the US situation.
In the US, we have experienced two years of pandemic in where the average American, a serial consumer, has been confined to his home and his wealth has increased thanks to tax aids, which have more than offset the impact of the pandemic. Since there is no shortage of work in America, with unemployment below 4%, consumer spending will remain very high also to compensate for the lack of consumption during the pandemic years, the so-called revenge spending, driven, according to some experts, by the negative psychological effects that affected the population during the pandemic.
Let's start with the economic data:
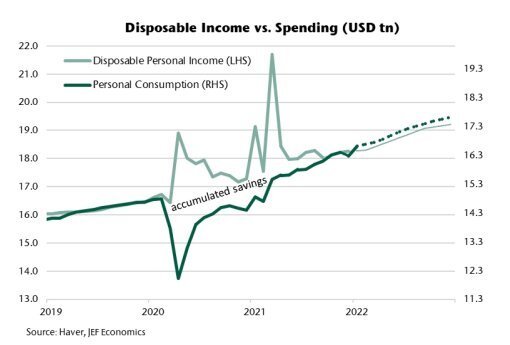
- Disposable income: Biden's fiscal stimulus, along with a reduction in pandemic-related spending, has increased Americans’ disposable income:
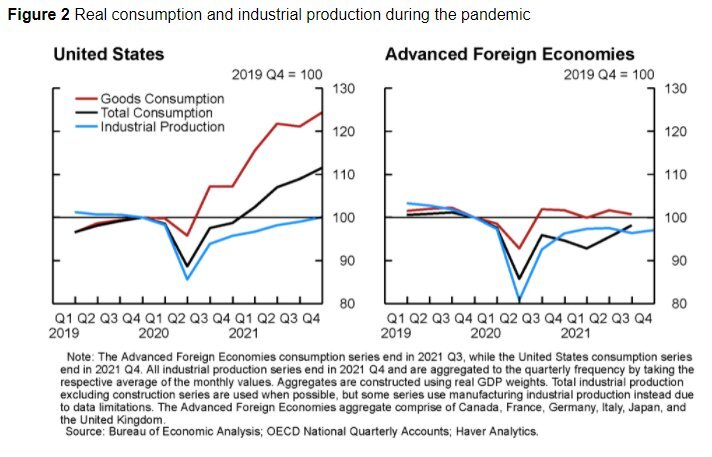
- Consumer spending: Omicron, inflation, the Russia-Ukraine conflict and the expiration of tax credits of child tax credit. These factors could not counterbalance the strength of the American consumer who, having more income and having been psychologically affected by the closure of the pandemic , continues to spend. Both consumption and production indices have exceeded their pre-pandemic levels in the US.
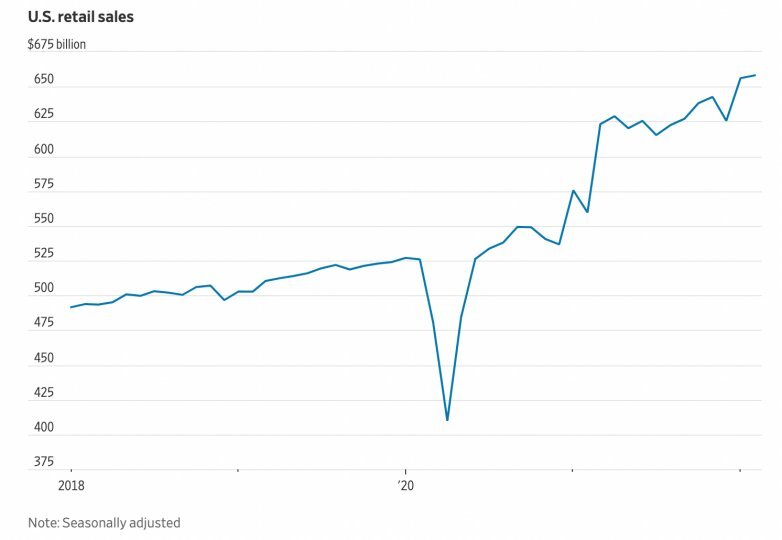
- Retail spending: The US retail sales index for January and March highlighted a continued increase in US consumer spending, despite rising inflation.
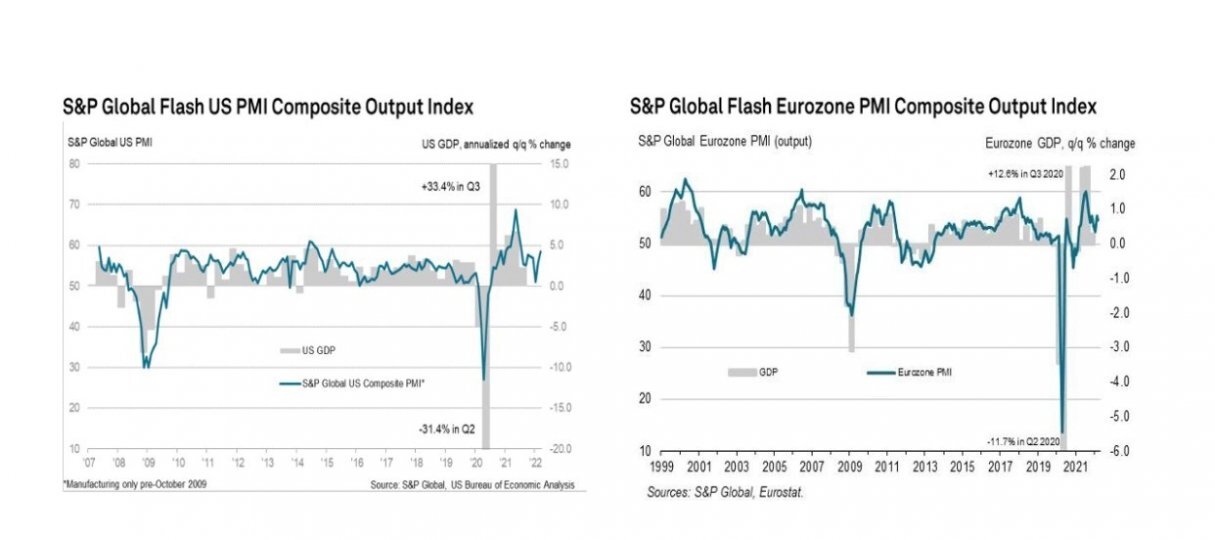
- Last week's PMI shows no slowdown. The PMI is the main global economic indicator and is based on monthly surveys of a group of companies. It gives an indication of what is actually happening in the private economic sectors by tracking variables such as production, new orders, employment levels and prices. The PMIs rose in the US and Japan and fell in Europe, the latter by just one point. Here are the details:
- The Eurozone PMI fell slightly from 55.5 to 54.4 percent.
- US PMI rose from 56 to 58.5 %.
- In Japan, manufacturing and services rose by 1% and 4% respectively.
- Cina’s Manufacturing & Services fell to 49.5 and 48.4, driven by lockdowns in many cities
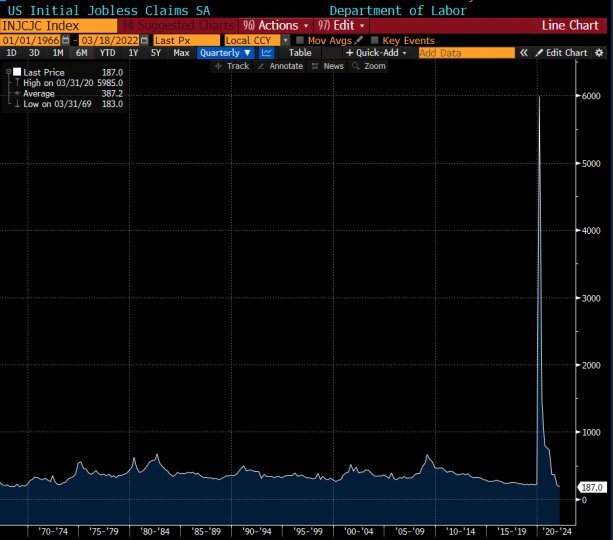
- Labor Market: The number of Americans filing for unemployment benefits last week fell to its lowest level in 52 years as the U.S. labor market continued to show strength despite rising costs and the pandemic. Jobless claims fell by 28,000 to 187,000 in the week to March 19, the lowest level since September 1969, the Labor Department said Thursday. Initial claims for unemployment benefits usually follow the pace of layoffs.
- Psychological effects of pandemics and revenge spending: Researchers at Harvard University surveyed over 21,000 US citizens from April 1 to May 3, 2021. About 28% of the group reported significant symptoms of depression and 25% reported symptoms of anxiety, in addition to 23% of respondents reporting suicidal thoughts. In March 2022, the WHO also reported that global anxiety and depression had increased by 25% in the first year of the pandemic. According to some experts, in an attempt to cope with this psychological predicament and fill the gaps left by the pandemic, Americans have increased their spending on leisure activities from 1 in December 2021 to 3 in February 2022 (+15%).
- US GDP: US GDP at +7.1%
- What the bond market is telling us
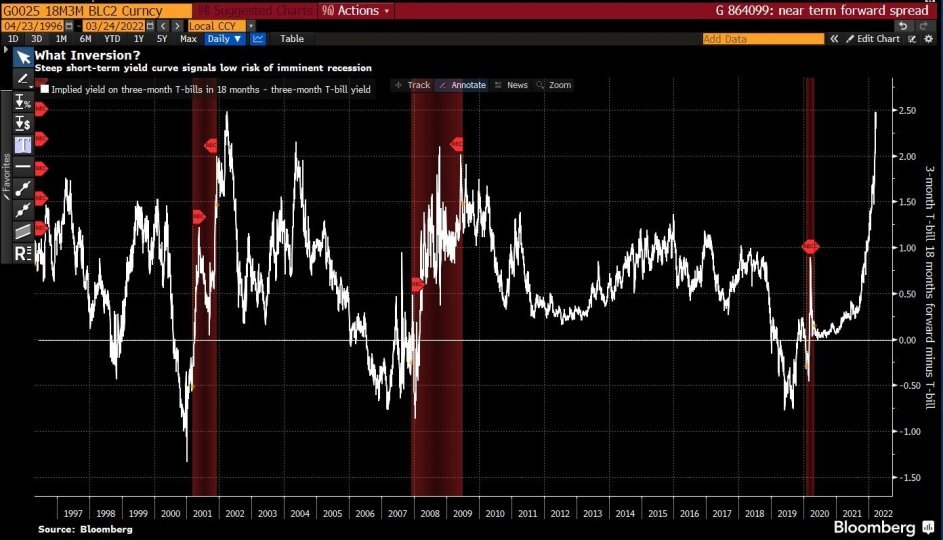
- Macroeconomic indicators
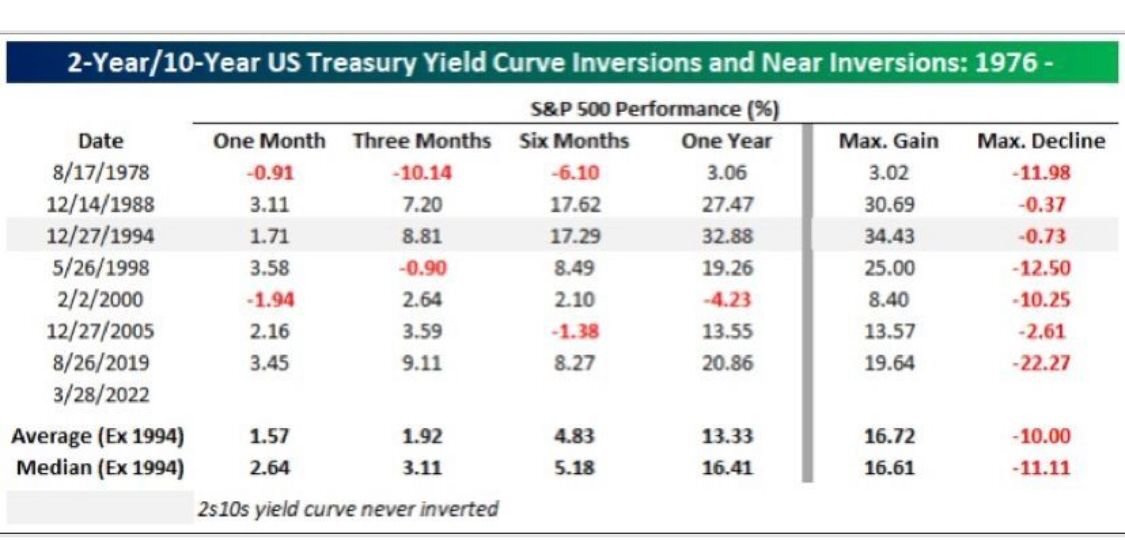
- The 2-10 year curve reversed on 29.03, and even after the eventual reversal, the S&P500yearly performance is 13%
The contents of this informative message are the result of the free interpretation, evaluation and appreciation of Pharus Asset Management SA and constitute simple food for thought.
Any information and data indicated have a purely informative purpose and do not in any way represent an investment advisory service: the resulting operational decisions are to be considered taken by the user in full autonomy and at his own exclusive risk.
Pharus Asset Management SA dedicates the utmost attention and precision to the information contained in this message; nevertheless, no liability shall be accepted for errors, omissions, inaccuracies or manipulations by third parties on what is materially processed capable of affecting the correctness of the information provided and the reliability of the same, as well as for any result obtained using the said information.
It is not permitted to copy, alter, distribute, publish or use these contents on other sites for commercial use without the specific authorization of Pharus Asset Management SA.